Think piece · 5 pages · by Dr. Lianne Lefsrud

Using Key Risk Indicators (KRIs) to Navigate Performance Metrics

Too many metrics, too little warning?

Starting with rail executive E. Hunter Harrison’s results at CN, Dr. Lianne Lefsrud explains the difference between leading and lagging indicators, how to tie key risk indicators to your major incident hazards using bowtie diagrams, and a practical method for decluttering an overgrown list of KPIs down to the indicators that matter.
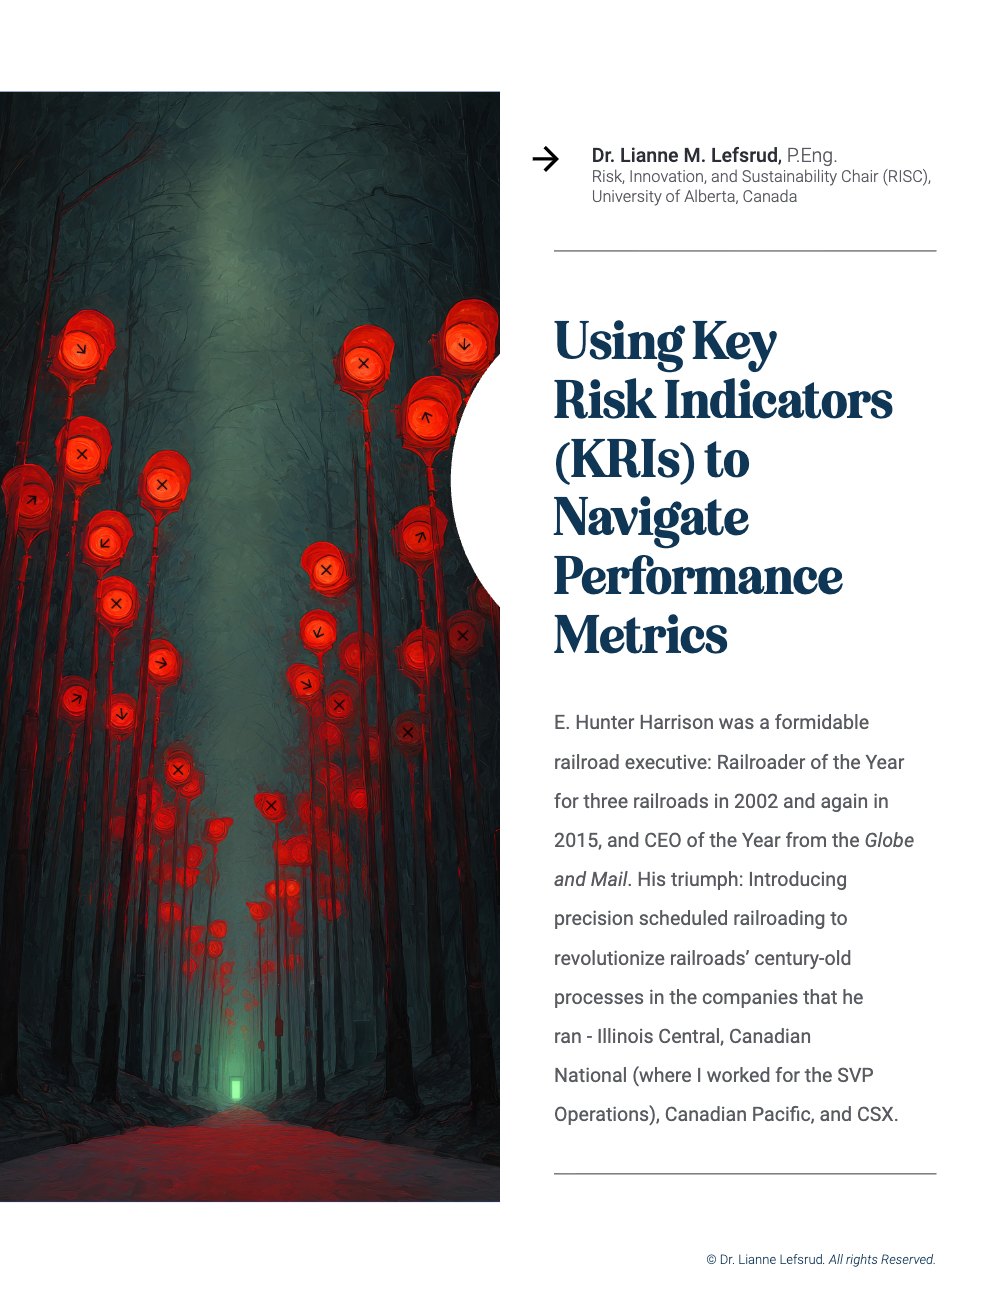
Page 1 of the PDF

  • E. Hunter Harrison at CN: profit margins from about 0% to 40%, and what performance metrics had to do with it.
  • Leading versus lagging indicators, and why to be highly skeptical of the generic safety pyramid.
  • Using bowtie diagrams to connect key risk indicators to your company-killer scenarios.
  • Criteria for a good indicator (valid, predictive, timely, not gameable) and a practical method for decluttering an overgrown list of KPIs.

Who should read it?

Executives and operations leaders drowning in dashboards, and the risk and safety teams who build them.