Rethinking Risk: Evidence-Based Insights
Dr. Lianne Lefsrud’s white papers challenge conventional thinking, addressing critical questions: How do you prove the value of preventing something that didn’t happen? Why do organizations drown in metrics yet miss their biggest risks?
Organizations with mature risk systems achieve superior performance, command premium valuations, and enable innovation.
These papers offer practical frameworks to transform your approach.
The bottom line: Risk management done right isn’t about saying “no”—it’s about enabling better decisions and creating lasting business value.
Download the White Papers
Explore Dr. Lianne Lefsrud’s research on operational risk management. These white papers provide evidence-based frameworks and practical insights for transforming how organizations approach risk, measurement, and business performance.
Click to read more and download the full PDF.
What is the value of Risk Management?
What is the Value of Risk Management?
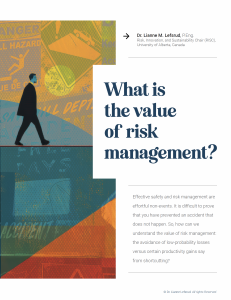
This white paper by Dr. Lianne Lefsrud addresses a fundamental challenge in risk management: proving the value of preventing incidents that don’t occur. The document demonstrates:
- Workplace incidents impose massive financial burdens on economies globally, representing several percentage points of GDP.
- Beyond direct costs, operational accidents significantly degrade business performance across multiple metrics including sales, profit margins, and growth rates.
- Effective risk management goes beyond loss prevention to actively create value through substantial improvements in operational reliability, safety performance, productivity, and quality.
Why This Matters
Risk management needs to be reframed from a compliance burden to a strategic value driver, and this paper provides leaders with evidence-based justification for risk investments. Organizations with poor risk management experience significant performance degradation, while those with mature risk systems command premium market valuations. Despite these clear benefits, very few organizations have achieved risk management maturity, presenting a major opportunity for competitive differentiation. The paper challenges the traditional view of risk professionals as barriers to progress, repositioning them as enablers of sustainable business performance and innovation.
Download Insight Risk Systems’ THINK PIECE: The Value of Risk Management by Dr Lianne Lefsrud.
Why is the value of risk management so difficult to measure?
Why is the value of risk management so difficult to measure?
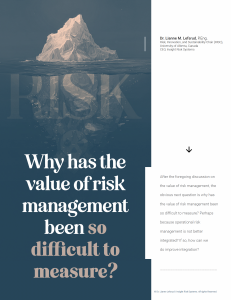
This white paper by Dr. Lianne Lefsrud addresses a critical challenge in organizational risk management: why the value of risk management has been so difficult to measure and how to improve integration across operations. The document presents four essential requirements for maximizing value from risk management:
- Establishing common language and data to ensure organizations have consistent definitions and meaningful denominators for risk calculations.
- Implementing regular risk assessments since dynamic conditions require frequent reassessment cycles, especially for high-consequence “Stuff That Kills You” (STKY) hazards.
- Integrating risk management across all business functions through a systems thinking approach rather than keeping it siloed.
- Using data-driven analysis with machine learning and incident analysis to identify leading indicators and precursory conditions.
Why It Matters
For leaders and decision-makers, the paper offers practical ways to evaluate whether risk data is meaningful—like when to ask about denominators and population data—and how to anticipate “Black Swan” events by understanding system interactions. Real case studies demonstrate measurable ROI, including one showing 47% of incidents tied to asset-integrity issues. For risk professionals, it moves beyond compliance to show how to extract insight from incident data, apply machine learning to find patterns, and integrate maintenance, production, and competency datasets into actionable leading indicators.
Download Insight Risk Systems’ Insight Risk Systems THINK PIECE: Why is the value of risk management so difficult to measure? by Dr Lianne Lefsrud.
Using Key Risk Indicators (KRIs) to Navigate Performance Metrics
What are Key Risk Indicators and how to best use them?
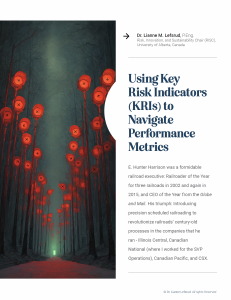
This white paper by Dr. Lianne Lefsrud tackles a fundamental challenge in operational risk management: organizations have too many performance metrics that fail to meaningfully predict or prevent major incidents. Using the case study of railroad executive E. Hunter Harrison—who transformed Canadian National’s profit margins from ~0% to 40% by cross-referencing previously siloed metrics—the document demonstrates how the right indicators create value and integration while scattered measurements undermine corporate performance.
The paper presents a systematic framework for developing effective Key Risk Indicators (KRIs):
- Connecting KRIs to specific hazards rather than using generic safety pyramids. Organizations should map their company-killer scenarios (facility explosions, dam failures, data breaches) using Bowtie Diagrams that identify causes, consequences, and controls for each loss-of-control event.
- Focusing on leading indicators that drive behavior, not just measure outcomes. The best KRIs are valid, predictive, behavioral-based, offer timely feedback, show sensitivity to small improvements, and motivate continuous improvement—while avoiding metrics that can be gamed or create perverse incentives.
- Creating line-of-sight from daily decisions to strategic goals by ensuring input variables predict process variables, which predict output variables, and that managers can actually control and are rewarded for managing these indicators effectively.
- Decluttering through systematic evaluation by creating enterprise-wide summary tables of all KPIs/KRIs across business units, correcting inconsistencies, deleting redundancies, and using machine learning to validate which indicators actually predict incident frequency and consequences.
Why It Matters
For leaders and executives, the paper reveals how scattered performance metrics (“if everything is a priority, nothing is”) waste management effort and create blind spots to catastrophic risks. The example of frontline supervisors held accountable for injury rates while lacking control over competency and turnover illustrates how misaligned indicators drive incident suppression and burnout rather than safety improvements.
For risk and operations professionals, it provides concrete criteria to evaluate existing metrics—like whether they measure what people do versus fail to do, qualify the quality of activities beyond counting them, and tie to human/organizational vulnerabilities like psychological safety. The guidance on composite indicators (safety:efficiency ratios), conversation analytics for measuring psychological safety, and avoiding gameable metrics offers practical alternatives to traditional lagging indicators like LTIR and TRIR. The document also challenges the ubiquitous but misleading safety pyramid, noting that no constant ratio exists between minor and major incidents across companies.
Download Insight Risk Systems’ Insight Risk Systems THINK PIECE: What are Key Risk Indicators and how to best use them? by Dr Lianne Lefsrud.
Where Does Fear Flourish in Organizations?
Where Does Fear Flourish in Organizations
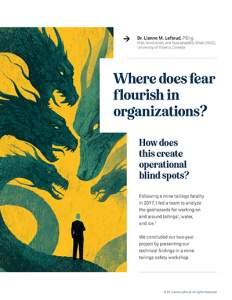
This white paper by Dr. Lianne Lefsrud explores how fear undermines operational risk management in hazardous industries. Based on research with 4,600+ workers following a mine tailings fatality:
- Fear is the primary barrier – 37% of workers cited fear as why hazards go unreported, exceeding lack of training (22.5%)
- Social consequences outweigh physical dangers – Workers fear job loss, bullying, and humiliation more than actual workplace hazards
- Psychological safety drives performance – Teams with high standards but low psychological safety operate in an “anxiety/fear zone” marked by burnout, high turnover, and poor learning
- Systemic breakdown occurs – When fear prevents hazard identification (Step 1), the entire risk management cycle fails, creating dangerous blind spots
- Social stability matters most – Workers’ fear stems from social rather than financial precarity, making traditional incentives ineffective
Why It Matters
Fear creates a paradox where safety systems fail when needed most. Employees who prioritize impression management over risk identification leave hazards hidden until they become incidents or fatalities. Organizations in the anxiety/fear zone experience safety failures plus broader performance issues including reduced innovation and knowledge hoarding. The framework helps leaders identify fear-paralyzed teams versus high-performing learning teams, offering specific interventions to shift dynamics. Leaders should distrust “good news only” dashboards and unanimous agreement—these often signal fear-driven information suppression rather than operational excellence. The research challenges conventional safety approaches focused on technical solutions while ignoring the human factors that determine whether risk systems actually function.
Download Insight Risk Systems’ Insight Risk Systems THINK PIECE: Where Does Fear Flourish in Organizations? by Dr Lianne Lefsrud.